The Many Maps of Michael
Wednesday, November 20, 2013
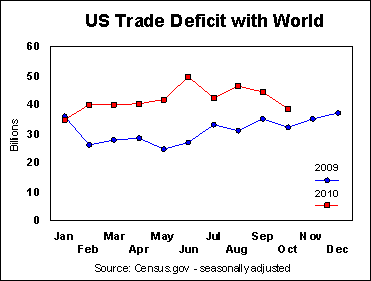
Bilateral Graph
http://seekingalpha.com/article/241440-will-octobers-improved-trade-deficit-continue
A bilateral graph is a graph that represents more than one variable and can be portrayed in many different ways. The map above shows the different trade deficit that the US had in 2009 vs. 2010.
No comments:
Post a Comment
Newer Post
Older Post
Home
Subscribe to:
Post Comments (Atom)
No comments:
Post a Comment